Worked example: lung adenocarcinoma vs normal lung
Which genes change in lung adenocarcinoma, the most common lung cancer in people who have never smoked? We reanalysed a public dataset of 27 patients, each with a tumor sample and a sample of their own normal lung.
- 27 patients each with a tumor and a matched normal sample
- 22,585 genes tested after setting aside weak genes
- 1,552 up and 2,130 down in tumors (adjusted p < 0.05, at least 2-fold)
Explore the full results yourself. Open this table in the DE Results tool to see the interactive volcano plot, search for any gene and run pathway enrichment.
Open in DE ResultsThe study
All 27 patients had never smoked and had early-stage (stage I) adenocarcinoma. The authors sequenced DNA and RNA from each tumor and its normal lung to study mutations. We use the RNA data to ask which genes are more or less active in the tumors.
Original paper: Sun Z, Wang L, Eckloff BW and colleagues, Mayo Clinic. Conserved recurrent gene mutations correlate with pathway deregulation and clinical outcomes of lung adenocarcinoma in never-smokers. BMC Medical Genomics 2014;7:32. doi:10.1186/1755-8794-7-32. Data: GEO GSE87340.
What we compared
Every patient gave one tumor and one normal lung sample, so all 54 samples are used and each tumor is compared with the same patient's normal lung.
We used 54 samples: 27 tumors and 27 normal, from 27 patients. The read counts are NCBI's own, made with one standard pipeline for every public human dataset. The samples used and the samples left out, with reasons are listed in full.
Quality checks
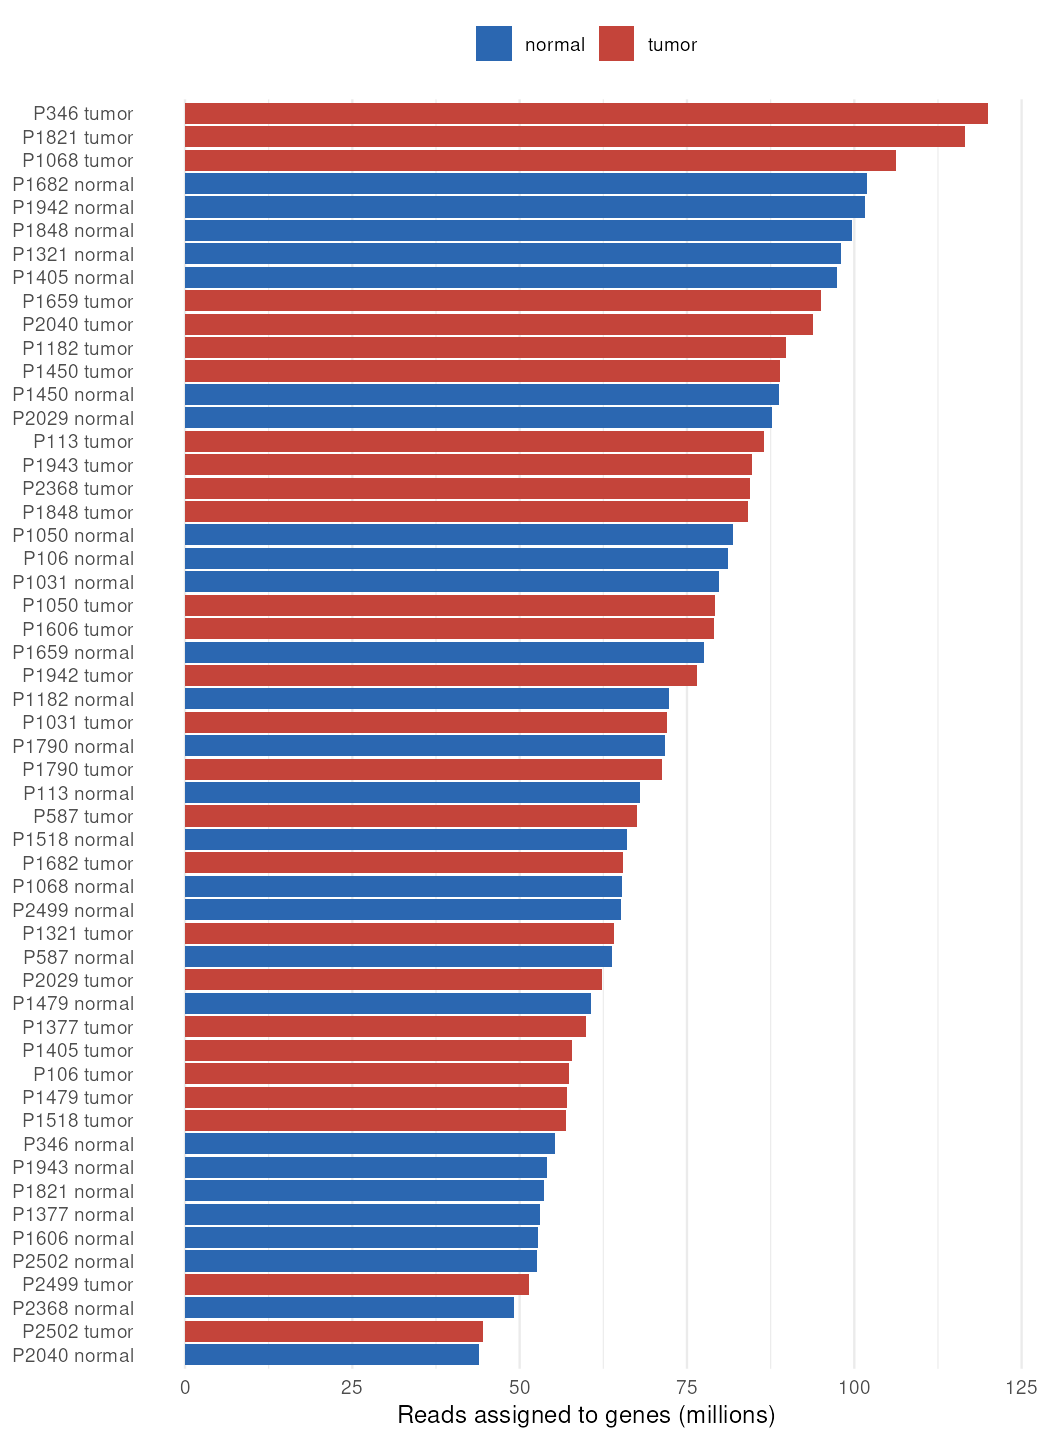
Sequencing depth. Each sample had 43.9 to 119.9 million reads counted on genes (median 71.9 million), which is plenty for this kind of analysis. See the depth of every sample.
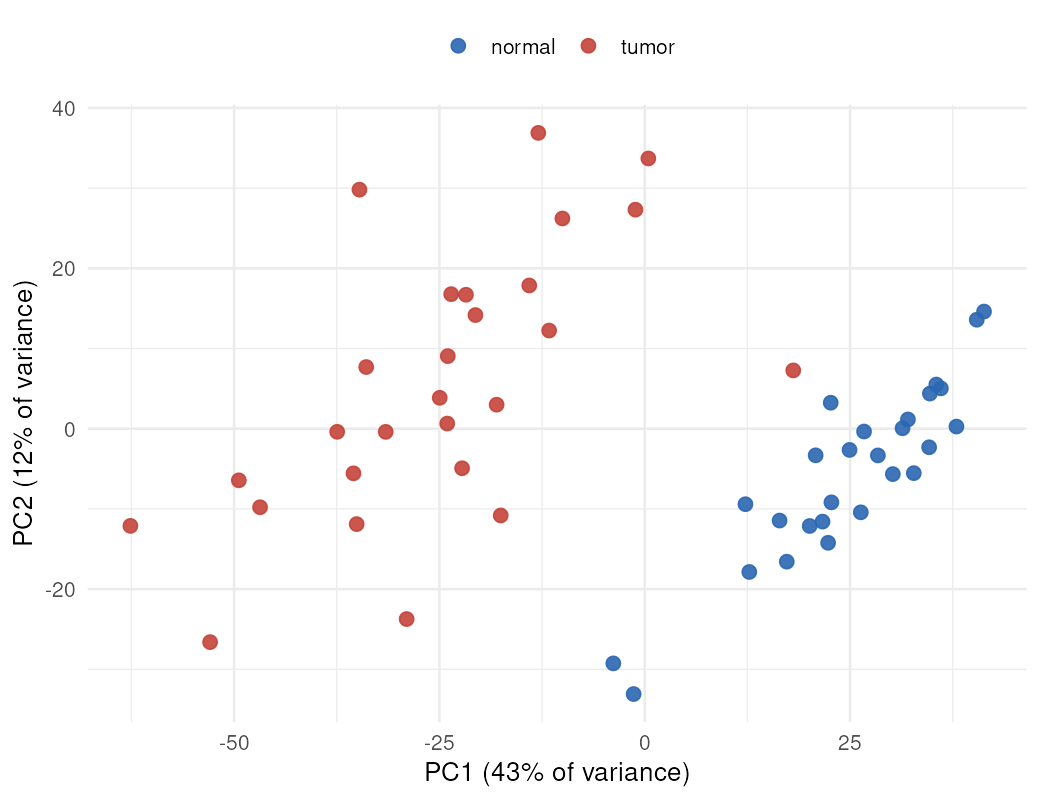
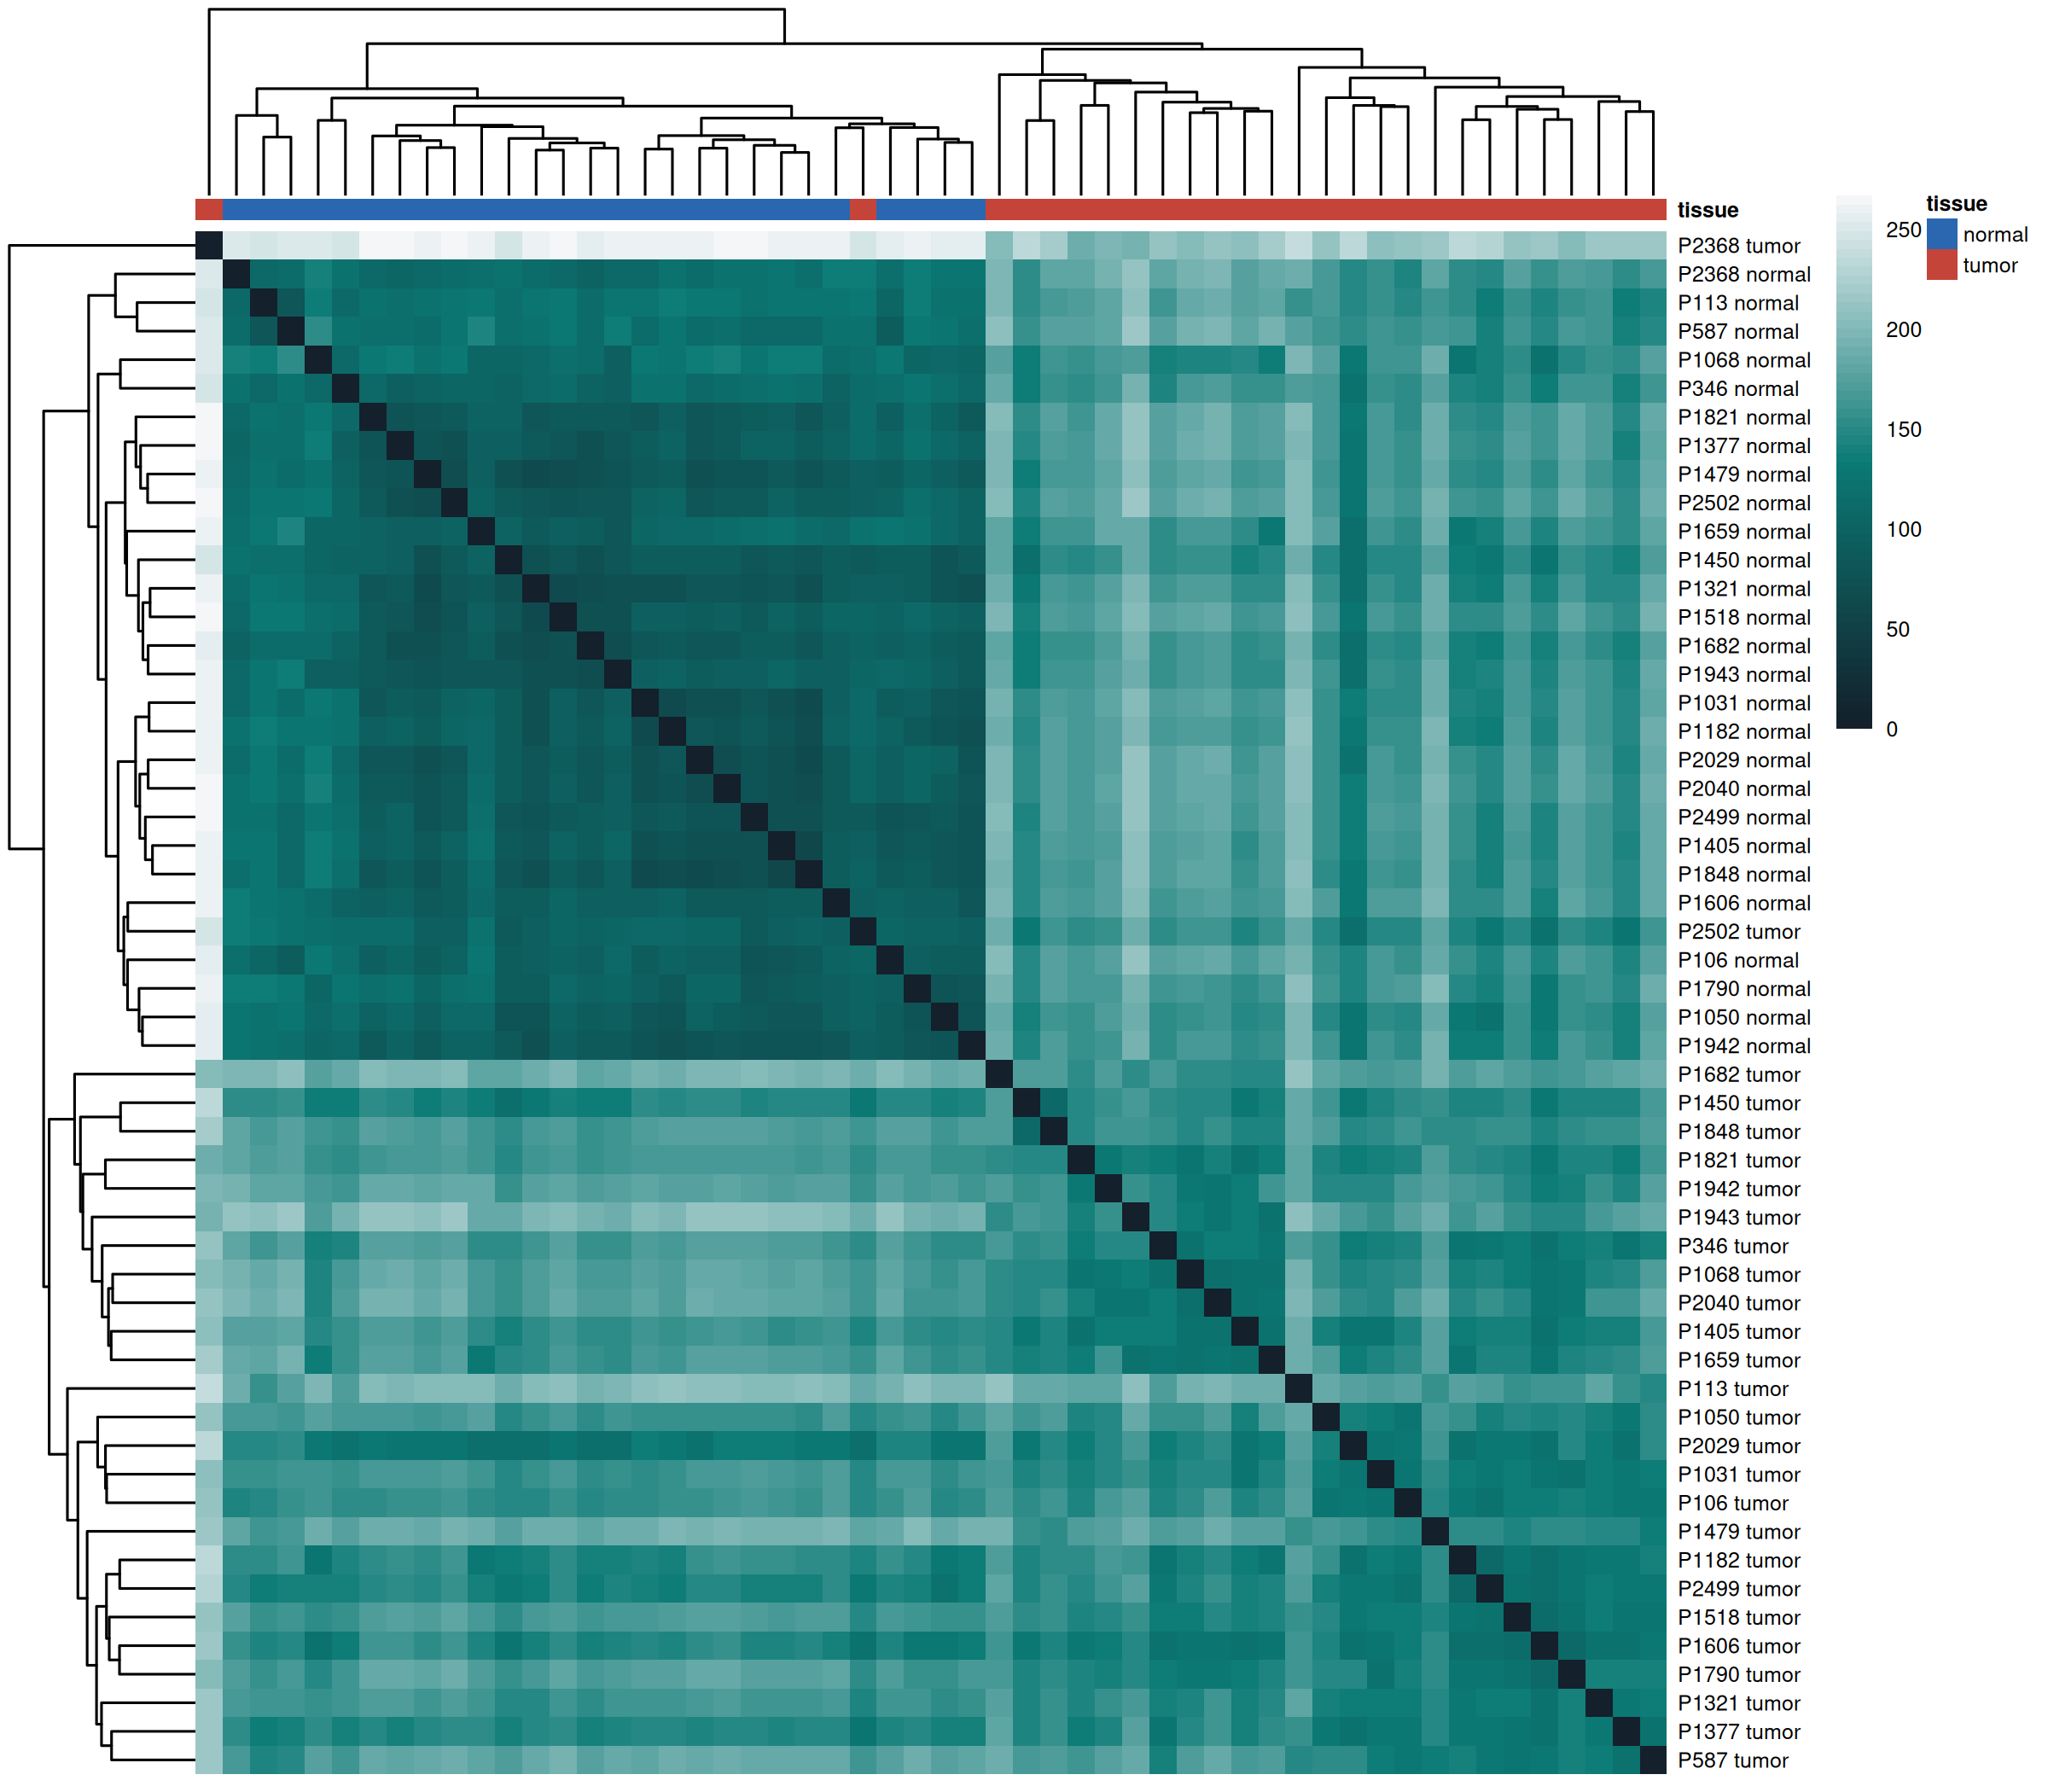
One tumor looks more like normal lung, and we kept it. The tumor sample from patient 2502 sits closer to the normal samples than to the other tumors. Its own normal sample looks normal, so this isn't a label swap. The tumor is recorded as BAC, a type that grows in a thin layer along the lung's air sacs, so the sample probably contains a lot of normal lung. That is real biology, not an error, so the sample stays in.
The label check for every sample and a sample-to-sample similarity map are available too.
Results
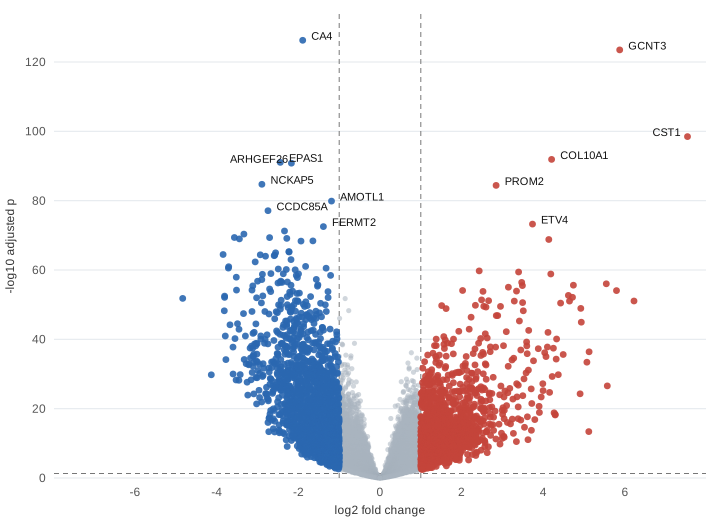
Of 22,585 genes tested, 14,797 differ with an adjusted p-value below 0.05. Many of those changes are small. Requiring at least a doubling or halving leaves 1,552 genes up and 2,130 down in tumors.
Strongest evidence: higher in tumors
| Gene | log2 fold change | Adjusted p |
|---|---|---|
GCNT3 | +5.87 | 3.2e-124 |
CST1 | +7.54 | 3.4e-99 |
COL10A1 | +4.21 | 1.3e-92 |
PROM2 | +2.84 | 4.0e-85 |
ETV4 | +3.74 | 5.6e-74 |
AFAP1-AS1 | +4.14 | 1.5e-69 |
GPT2 | +2.43 | 1.9e-60 |
LINC01426 | +3.40 | 3.8e-60 |
XDH | +4.18 | 1.4e-59 |
ADM2 | +3.47 | 3.7e-57 |
Strongest evidence: lower in tumors
| Gene | log2 fold change | Adjusted p |
|---|---|---|
CA4 | -1.89 | 5.4e-127 |
EPAS1 | -2.44 | 8.9e-92 |
ARHGEF26 | -2.17 | 1.6e-91 |
NCKAP5 | -2.89 | 1.9e-85 |
AMOTL1 | -1.19 | 1.4e-80 |
CCDC85A | -2.74 | 8.0e-78 |
FERMT2 | -1.39 | 3.0e-73 |
NOVA2 | -2.34 | 5.5e-72 |
RTKN2 | -3.34 | 4.5e-71 |
SH3GL3 | -3.57 | 4.2e-70 |
A log2 fold change of +1 means twice as active in tumors; -3 means one eighth as active. The tables are ordered by strength of evidence, not by size of change.
Pathways
We ran the DE Results tool's own enrichment analysis on this table, with its default settings: genes at least 2-fold changed with an adjusted p-value below 0.05, gene sets of 5 to 500 genes, and the tested genes as the background. Up and down genes are tested separately. These are the same results you get by opening the example and choosing each library.
- Up in tumors: antibodies, which is a lesson in reading pathway results. The strongest Reactome results are “Classical antibody-mediated complement activation” and “Scavenging of heme from plasma”. But the changed genes behind them are almost all antibody genes: 78 of 78 for the first and 76 of 78 for the second. They don't mean complement or heme handling is up. They mean the tumors contain more antibody-making B cells and plasma cells, which GO shows directly as immunoglobulin mediated immune response.
- Down in tumors: the lung's blood vessels and muscle. Blood circulation and blood vessel development (GO), and Muscle contraction (Reactome), fall because normal lung is rich in fine blood vessels and smooth muscle that tumor tissue replaces. Hemoglobin genes are lower too, fitting less blood in tumor samples.
- Cell division is weaker here than in the liver example. It is significant (WikiPathways includes a sister chromatid separation pathway) but not near the top, which fits these being early-stage tumors.
GO Biological Process: genes higher in tumors
119 of 7,413 gene sets with FDR < 0.05. Background: 14,276 tested genes in this library, 1,001 of them higher.
| Gene set | Genes | Fold | FDR |
|---|---|---|---|
| immunoglobulin mediated immune response (GO:0016064) | 70 / 121 | 8.2 | 1.7e-45 |
| B cell mediated immunity (GO:0019724) | 70 / 126 | 7.9 | 3.9e-44 |
| lymphocyte mediated immunity (GO:0002449) | 72 / 185 | 5.5 | 2.7e-32 |
| adaptive immune response based on somatic recombination of immune receptors built from immunoglobulin superfamily domains (GO:0002460) | 73 / 209 | 5.0 | 2.9e-29 |
| leukocyte mediated immunity (GO:0002443) | 72 / 226 | 4.5 | 5.1e-26 |
Reactome: genes higher in tumors
68 of 2,095 gene sets with FDR < 0.05. Background: 9,898 tested genes in this library, 678 of them higher.
| Gene set | Genes | Fold | FDR |
|---|---|---|---|
| Classical antibody-mediated complement activation | 78 / 83 | 13.7 | 9.2e-83 |
| Scavenging of heme from plasma | 78 / 88 | 12.9 | 5.2e-78 |
| Creation of C4 and C2 activators | 78 / 90 | 12.7 | 1.4e-76 |
| FCGR activation | 78 / 90 | 12.7 | 1.4e-76 |
| Initial triggering of complement | 78 / 98 | 11.6 | 8.5e-71 |
GO Biological Process: genes lower in tumors
505 of 7,413 gene sets with FDR < 0.05. Background: 14,276 tested genes in this library, 1,311 of them lower.
| Gene set | Genes | Fold | FDR |
|---|---|---|---|
| blood circulation (GO:0008015) | 90 / 318 | 3.1 | 2.6e-19 |
| circulatory system process (GO:0003013) | 103 / 407 | 2.8 | 1.1e-18 |
| vasculature development (GO:0001944) | 83 / 305 | 3.0 | 7.1e-17 |
| blood vessel development (GO:0001568) | 77 / 288 | 2.9 | 3.7e-15 |
| regulation of system process (GO:0044057) | 102 / 450 | 2.5 | 3.7e-15 |
Reactome: genes lower in tumors
41 of 2,095 gene sets with FDR < 0.05. Background: 9,898 tested genes in this library, 872 of them lower.
| Gene set | Genes | Fold | FDR |
|---|---|---|---|
| GPCR ligand binding | 84 / 327 | 2.9 | 7.2e-17 |
| Class A/1 (Rhodopsin-like receptors) | 64 / 233 | 3.1 | 3.8e-14 |
| Muscle contraction | 54 / 183 | 3.4 | 2.7e-13 |
| GPCR downstream signalling | 100 / 494 | 2.3 | 2.7e-13 |
| Peptide ligand-binding receptors | 36 / 135 | 3.0 | 3.4e-07 |
“Genes” is how many of the set's genes changed, out of all the set's genes in the background. “Fold” is how many times more changed genes the set has than expected by chance. Releases: GO Biological Process ontology release 2026-07-26, human annotations generated 2026-05-21; Reactome release 98; WikiPathways release 2026-11-10. All significant gene sets from all three libraries, with their genes: enrichment.txt. The tool's library releases are refreshed monthly, so results in the tool may differ slightly from those shown here.
What the results show
- Genes of the lung's air sacs go down. AGER and SFTPC mark the two kinds of cell that line the air sacs, and CA4 and EPAS1 are active in the fine blood vessels around them. Tumor tissue has fewer of these structures than normal lung.
- Tissue-remodelling genes go up. SPP1, MMP1, COL10A1 and COL11A1 are involved in breaking down and rebuilding the scaffolding between cells, a common feature of growing tumors.
- Cell-division genes go up. TOP2A and MKI67 rise, as expected for dividing tumor cells, though less than in the liver example. These are early-stage tumors.
- EGFR changes little in activity. EGFR is a key gene in never-smoker lung cancer, but what matters there is usually a mutation in the gene, which an expression analysis like this doesn't see.
These are broad patterns that match what is already known about this cancer, which is a useful sign the analysis behaves as it should. They are not new findings.
Limits
- The normal lung was taken from the same operation and may already carry early changes.
- All patients had never smoked and had stage I disease, so the results may not apply to smokers or to advanced cancer.
- A tumor sample is a mix of tumor cells, immune cells and supporting tissue, so some changes reflect a different mix of cells rather than changes inside cancer cells.
- This is a teaching example, not medical advice.
How we ran it
DESeq2 1.50.2 in R 4.5.2 (Bioconductor 3.22), comparing tumor with normal within each patient (design ~ donor + tissue). Genes were kept if they had at least 10 reads in at least 27 samples. P-values were adjusted with the Benjamini-Hochberg method, and fold changes were shrunk with apeglm 1.32.0. Each step explained in plain words.
The volcano plot and pathway results were made by the DE Results tool itself (version 0.3), run on the results table in a browser, not by separate code.
Files: full results for every tested gene · pathway results · volcano plot (SVG) · summary · downloaded files and checksums · software versions · code: download step, analysis step and tool step. The analysis ran in a fixed Bioconductor container: ghcr.io/bioconductor/bioconductor_docker@sha256:e34177896c1579f66d48b756e4229b58237499183a089da084af72d7aba1d40a.
If you use these results, please cite the original study above. Our reanalysis may differ from the authors' own results because the read counts, filtering and statistical method differ.